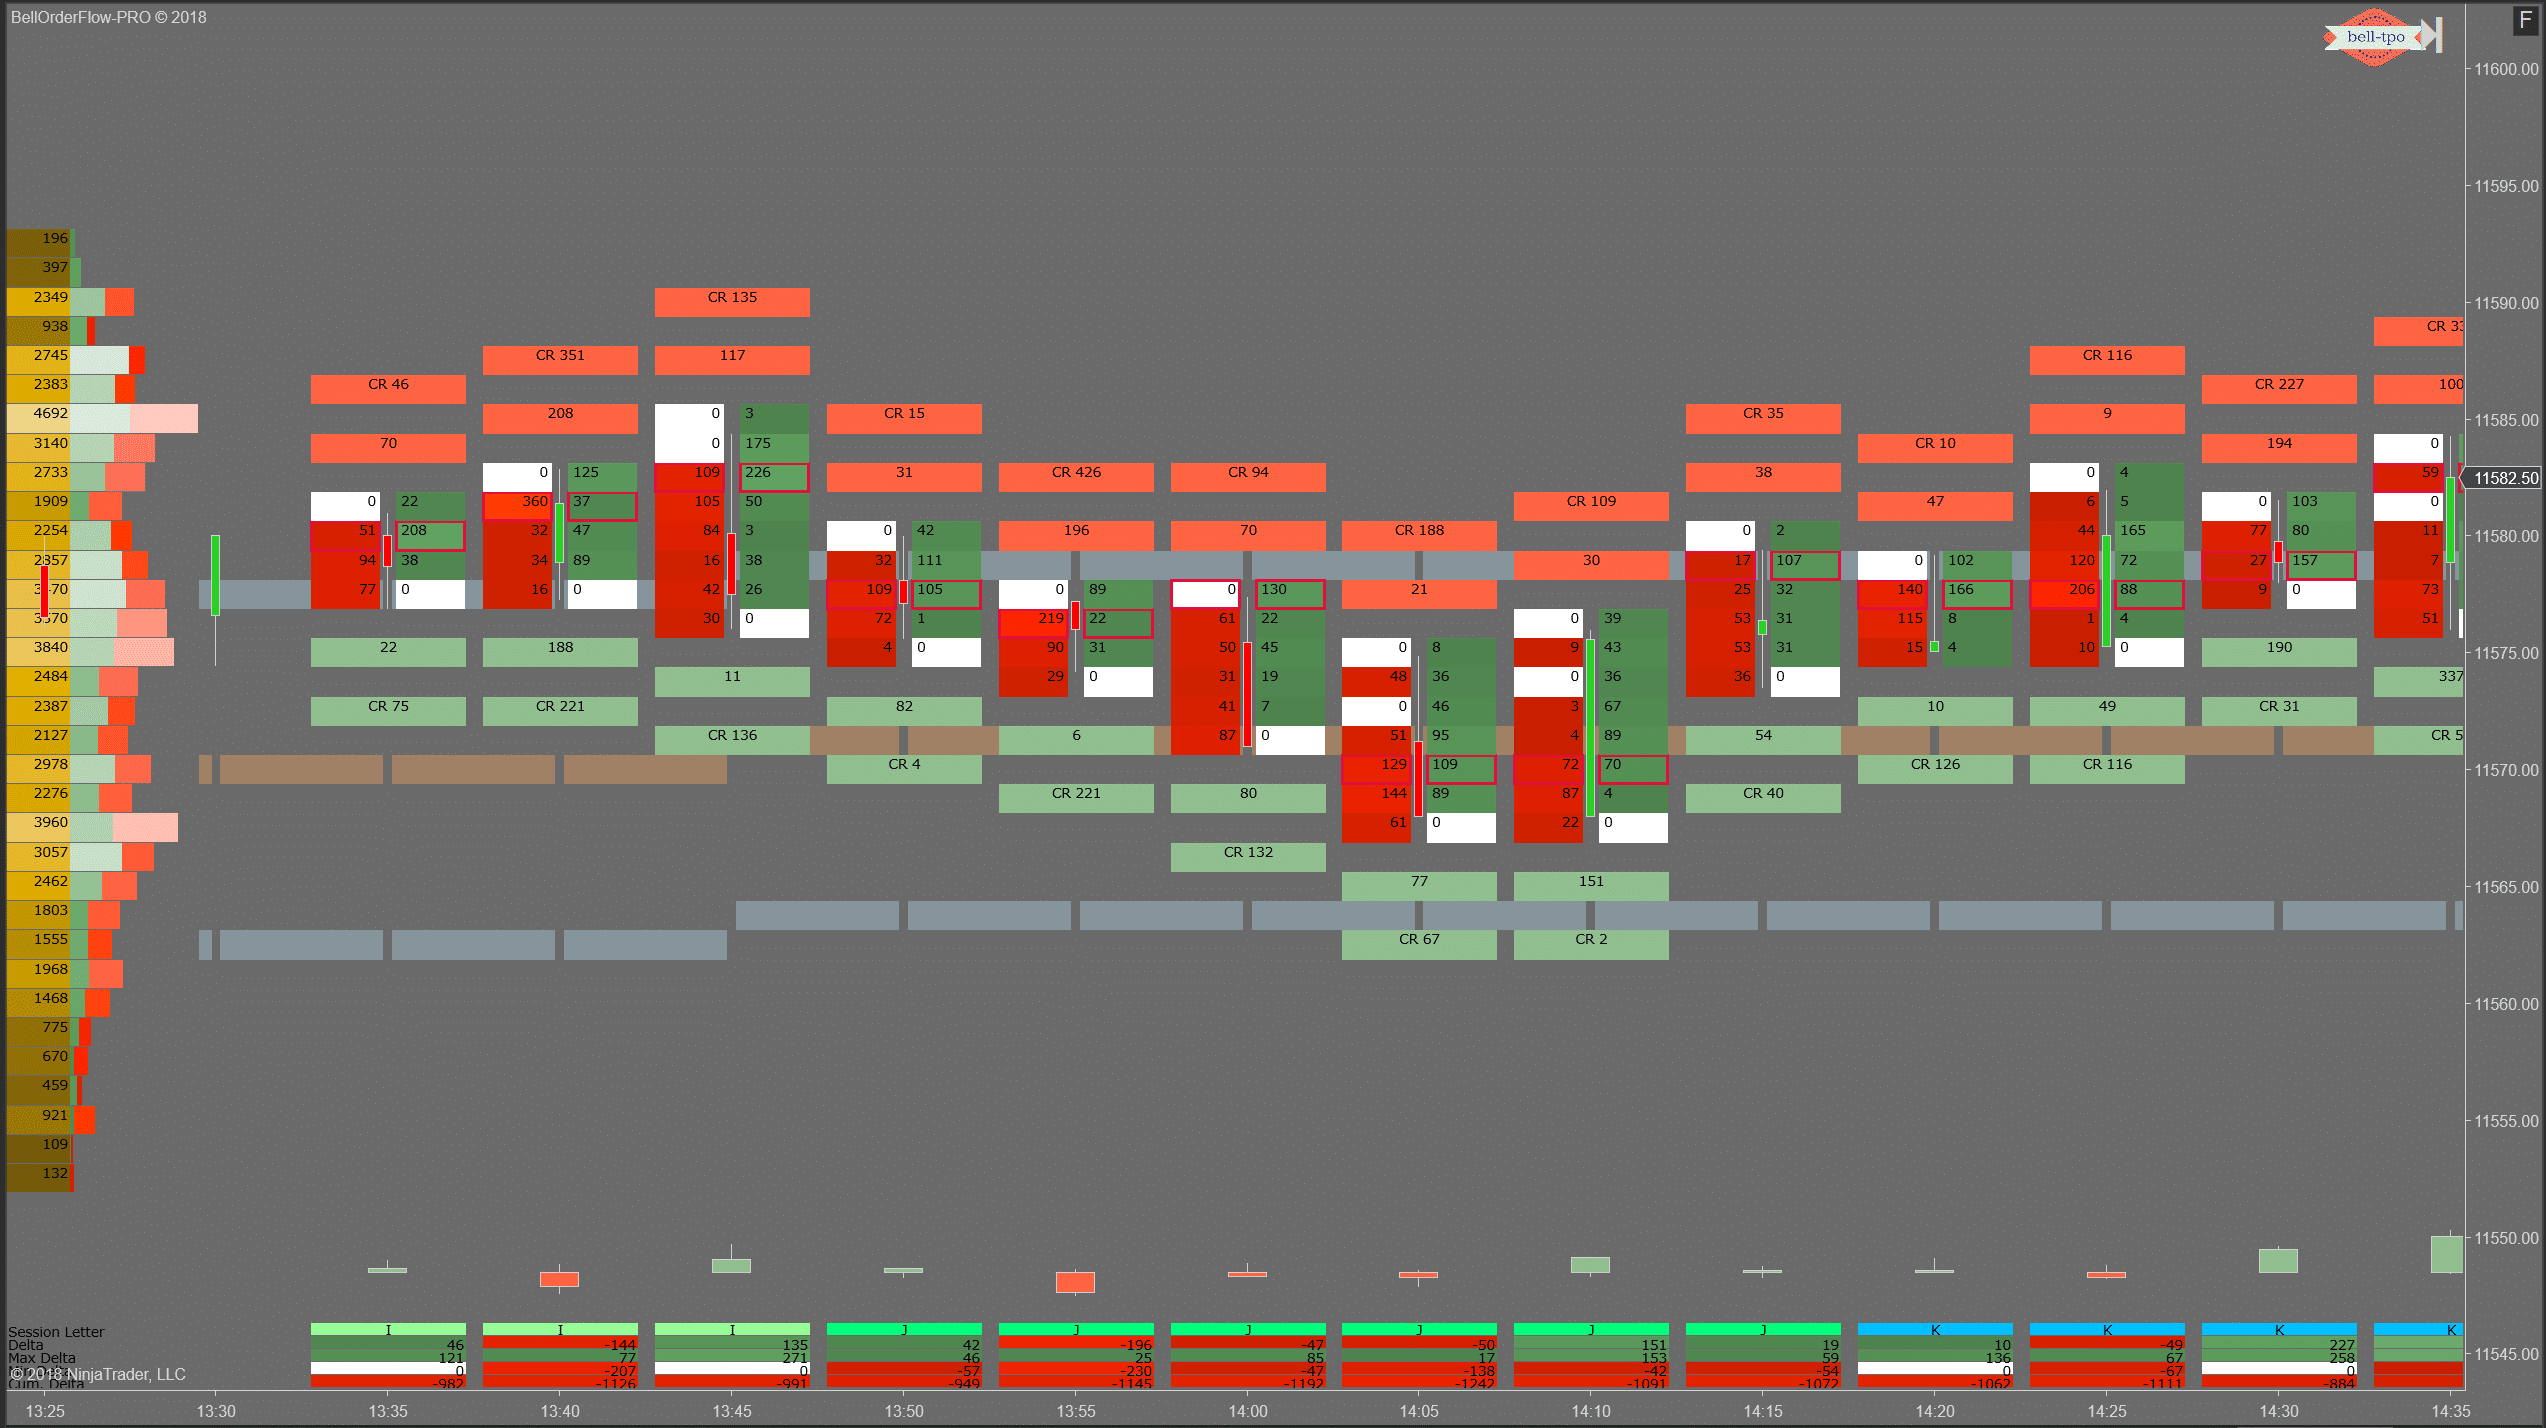
How to use Order Flow :
Order Flow Trading is not technical analysis or fundamental analysis, although both of those certainly do play a part in order flow analysis. Market depth of a stock shows the standing limit buy orders and standing limit sell orders. Simply put, the market depth represents the total bid and offer at different prices pending for execution. Each bid and offer price represents, willingness to buy or sell the stock at a particular time. However, that does not determine the direction of the market. The price of the stock increases or decreases when the orders are actually executed. Order Flow records all the traded information such as quantity bought or sold at a particular price and it is graphically displayed on the chart in realtime so that it becomes easy to identify what the market participants are expecting in the near future, whether the demand or supply is strong at a specific price. For ex. huge quantity of a stock is bought at a particular price by an institutional player, the price of the stock starts increasing and the same can be easily identified in the Order Flow chart graphically. This kind of information would not be displayed on a Candle Stick or Bar chart. Order Flow helps to identify the internal structure or sub divide the auction process in detail thereby the traders can determine the increase / decrease in the price due to the impact of demand of supply at a particular time. By using Order Flow, the trader can decide the future price action of the stock from the graphically represented information.


