
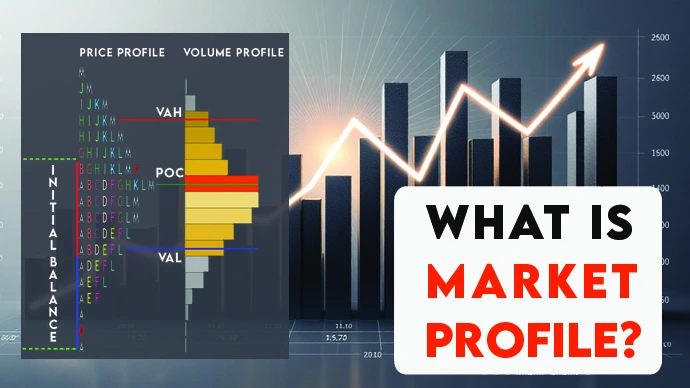
Market Profile is a trading tool based on Auction Market Theory, which views the market as a continuous auction between buyers and sellers. It organizes price movements into patterns, showing where most trading happens and helping traders identify key price levels. Unlike complex methods involving math or physics, Market Profile focuses on observing price behavior to distinguish trading days (good opportunities) from non-trading days (uncertain or slow periods). This makes it important for traders as it highlights key price levels, identifies market patterns, and determines the best time to trade. By using Market Profile, traders can save time, reduce risk, and improve decision-making, ultimately trading smarter by knowing when to act and when to wait.
Market Profile is a way of organizing data. It organizes data in such a way that it reveals various AMT principles in real time.
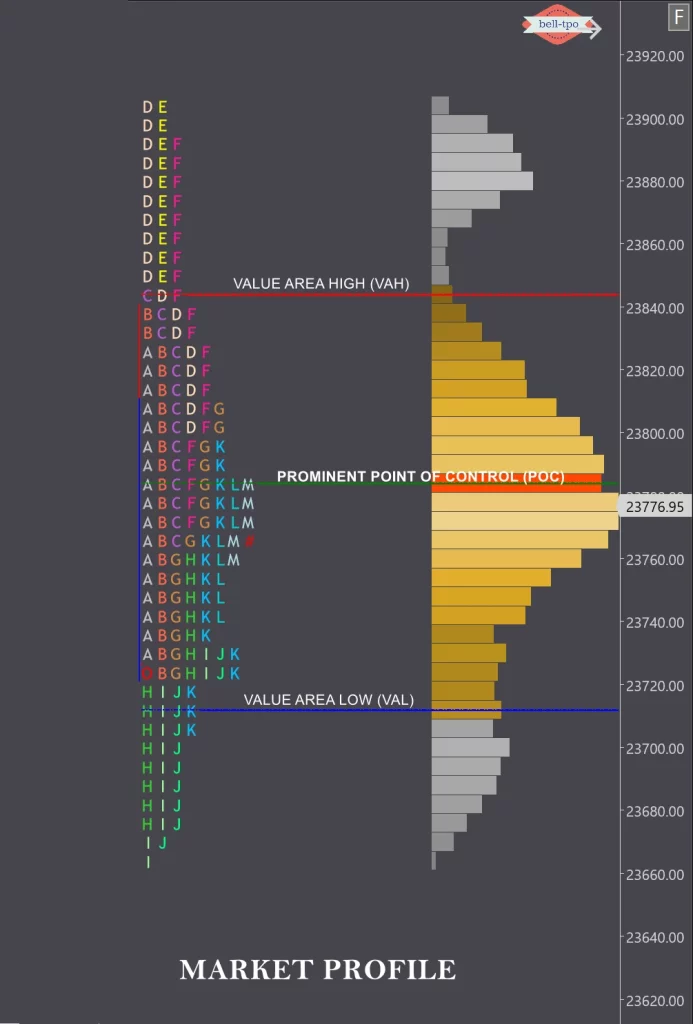
In a MP chart the regular bars and candlesticks are replaced by letters (one letter for each 30 min bar is the most common setting). These letters are then collapsed on to the price axis to give it a distinct shape, which sometimes resembles a bell curve.
Auction Market Theory explains how buyers and sellers interact in a market to determine the price of an asset. It works just like a real-life auction, where prices move based on demand and supply:
This theory helps traders understand how the market moves and where the most activity occurs, making it easier to spot patterns, trends, and trading opportunities.
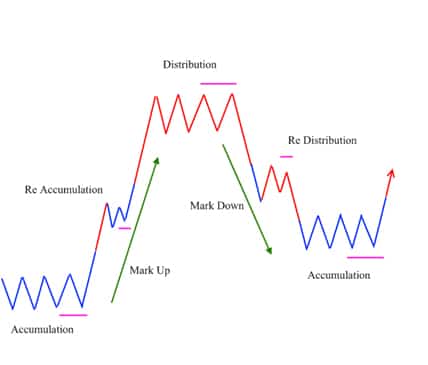
It is the cycle in which the markets move up and down through various stages such as Accumulation – Mark Up – Distribution – Mark Down and sometimes the intervening stages of Re-accumulation and Re-distribution.
Auction Market Theory proposes that all financial markets work like an auction. That the price will move higher in search of sellers and price will move down in search of buyers.
Once the price has move low enough to uncover buying strong enough to stop the down auction, a new auction up will begin.
Market Profile Charts can be used effectively along with AMT principles to trade low risk opportunities in financial markets.
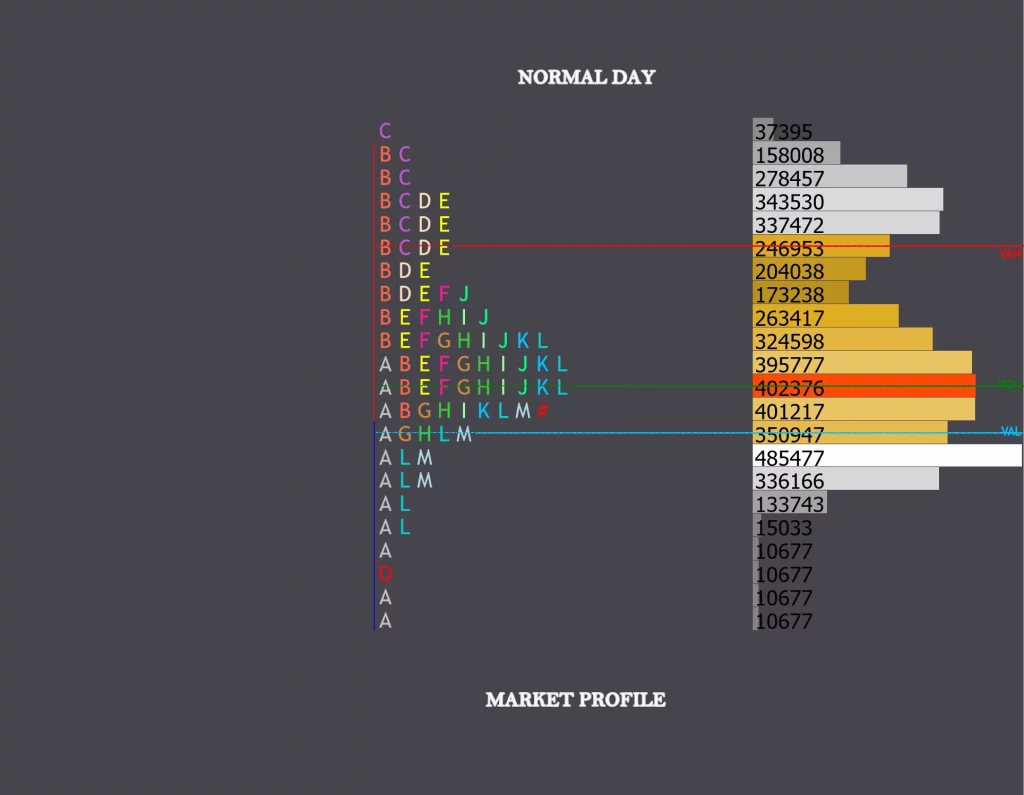
When price stays within the initial balance the whole day the day type is called as a Normal Day.
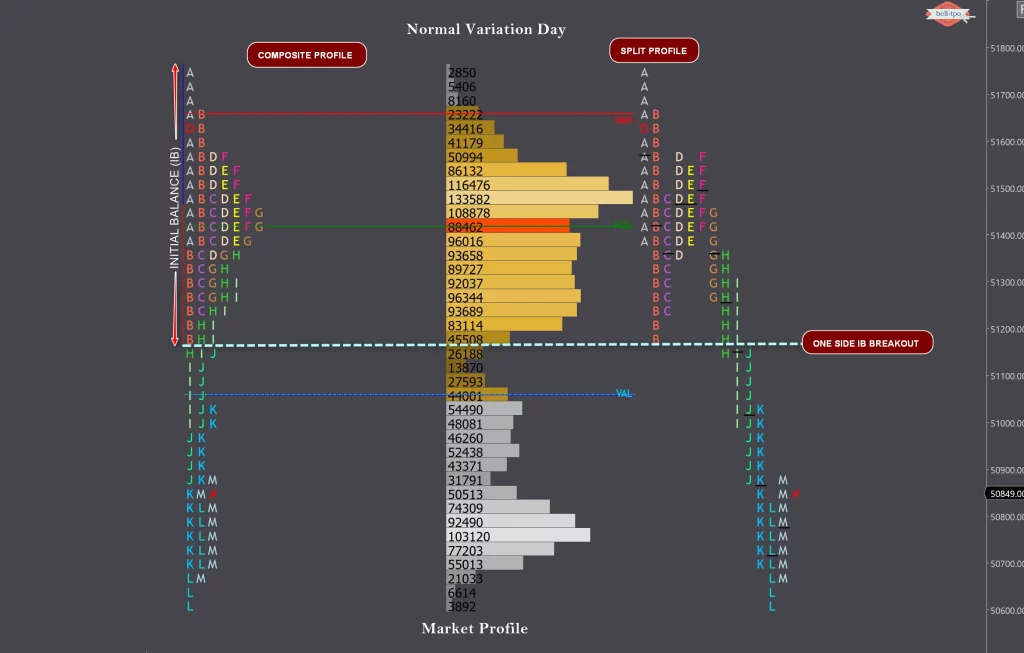
When price moved outside of initial balance in subsequent periods, but does not create a range greater than twice the initial balance the day is called a Normal Variation Day.
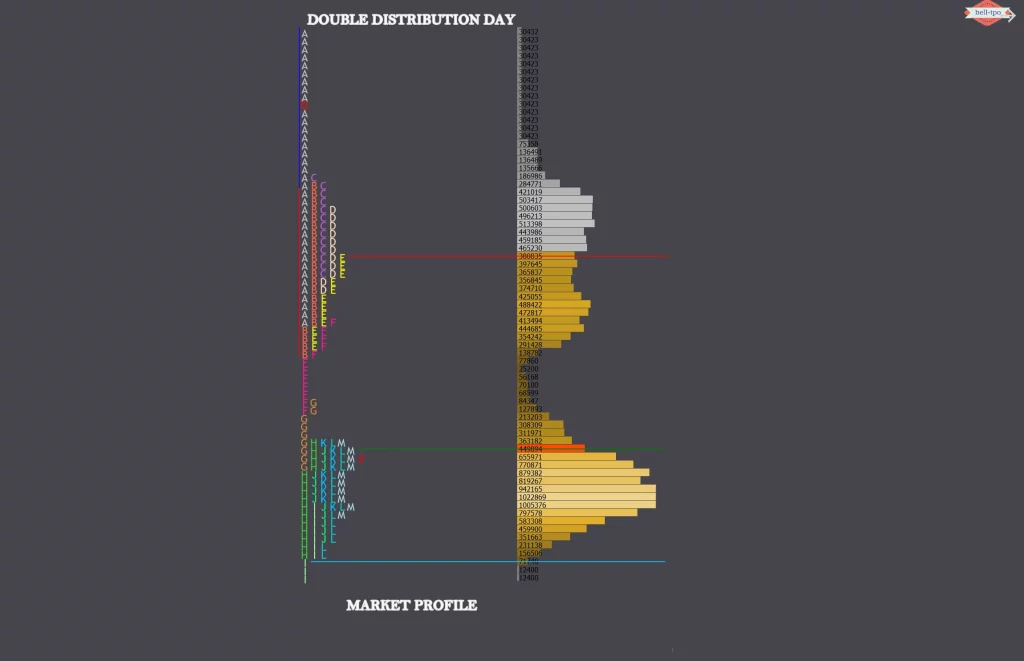
When price forms a narrow balance to begin with and then BO/BD from that balance and then form a second balance in the same day, the day type is called a double distribution trend day.
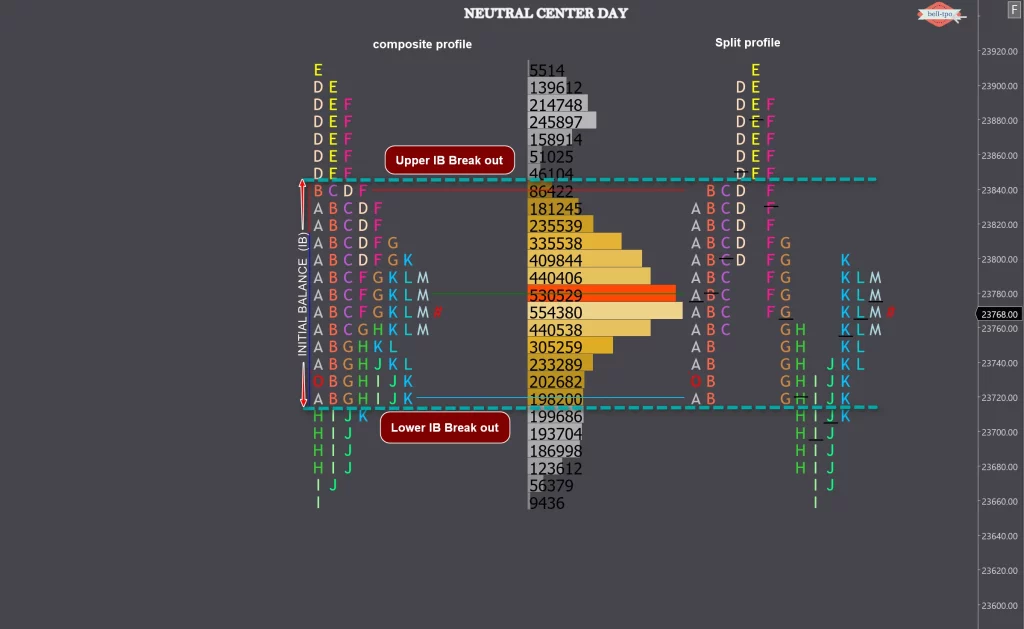
When price extends range beyond the IB in both directions and closes within the value area, it is called a Neutral Day.
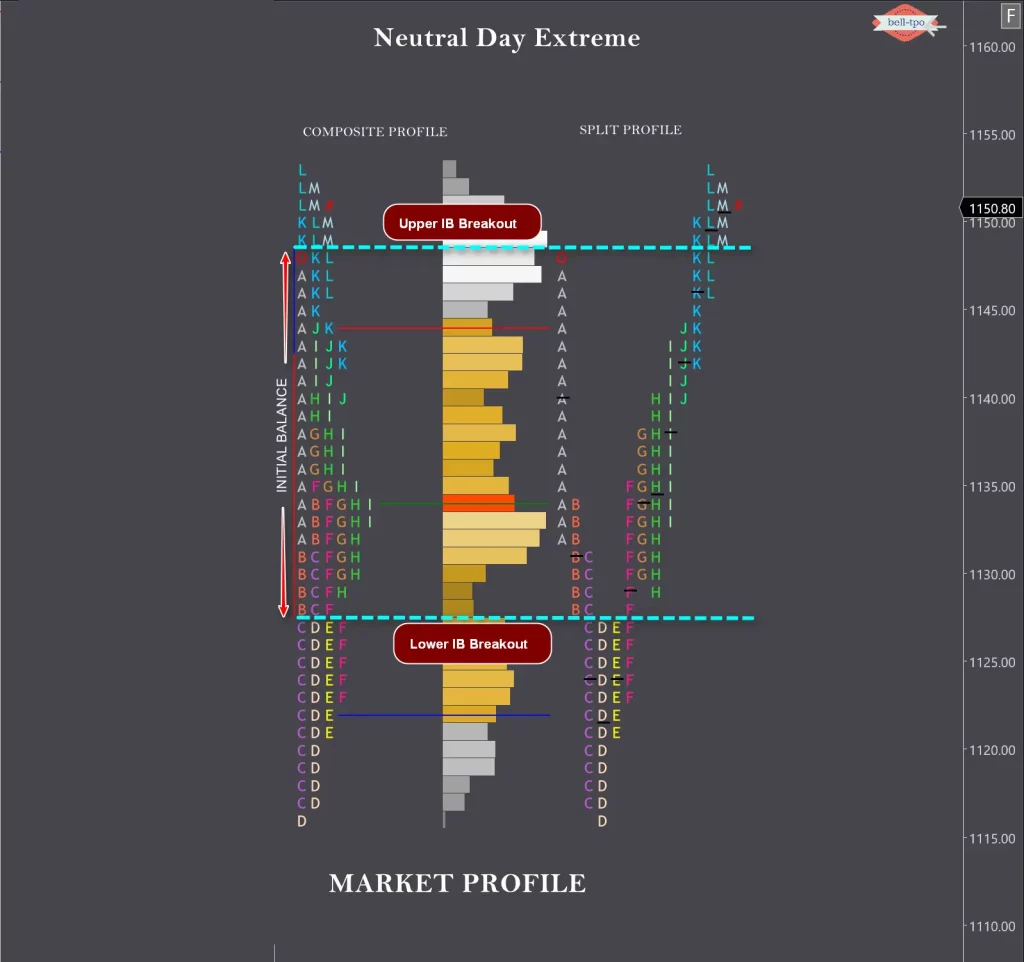
When price extends the range in one direction and then moves in opposite direction and extending the range at the other end, as well as closing on the extreme, is called a Neutral Extreme day.
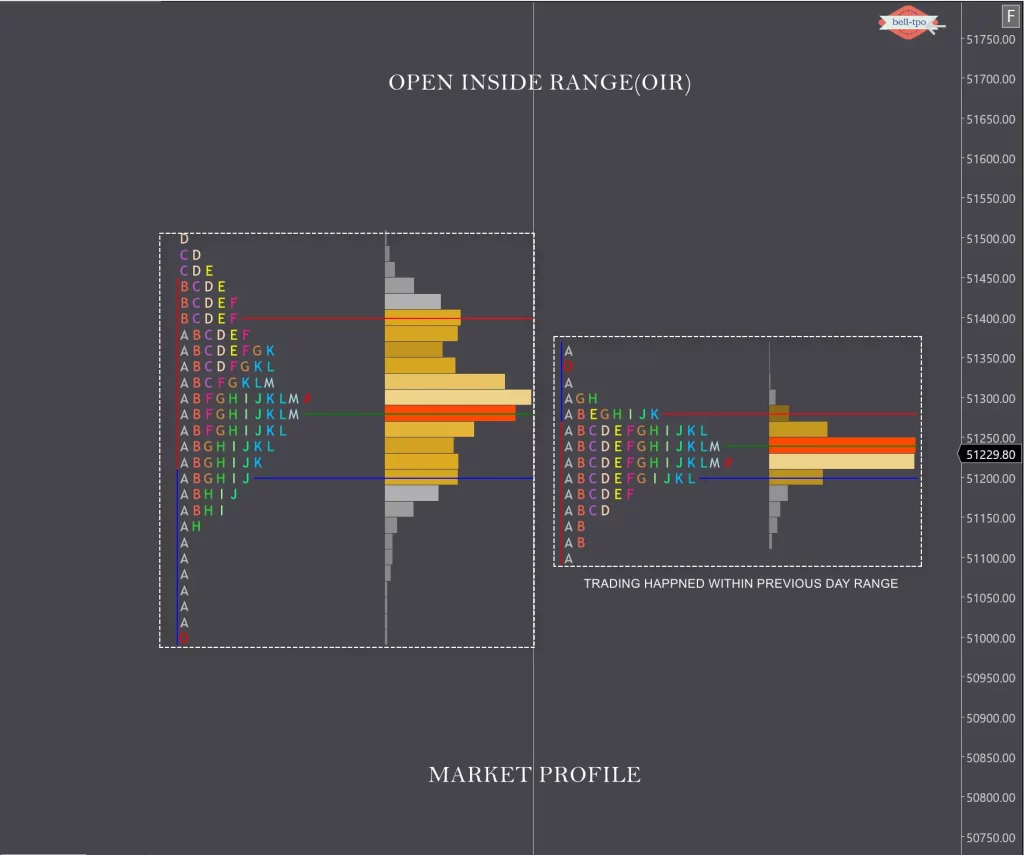
OIR
When prices open inside yesterday’s range, we call it Open Inside Range.
The range development potential is limited.
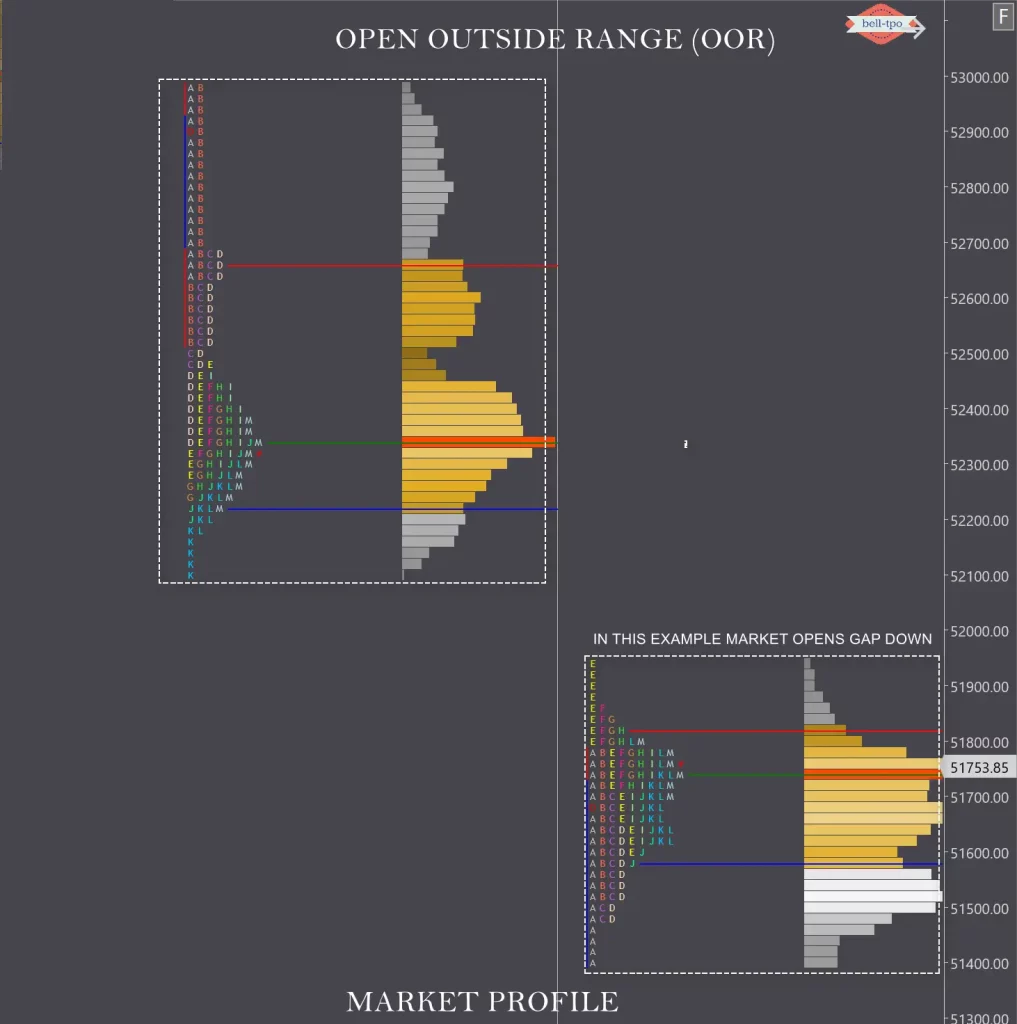
OOR
When prices open outside yesterday’s range, we call it Open Outside Range.
In this scenario the range development tends to be wide, and dynamic moves can be expected.
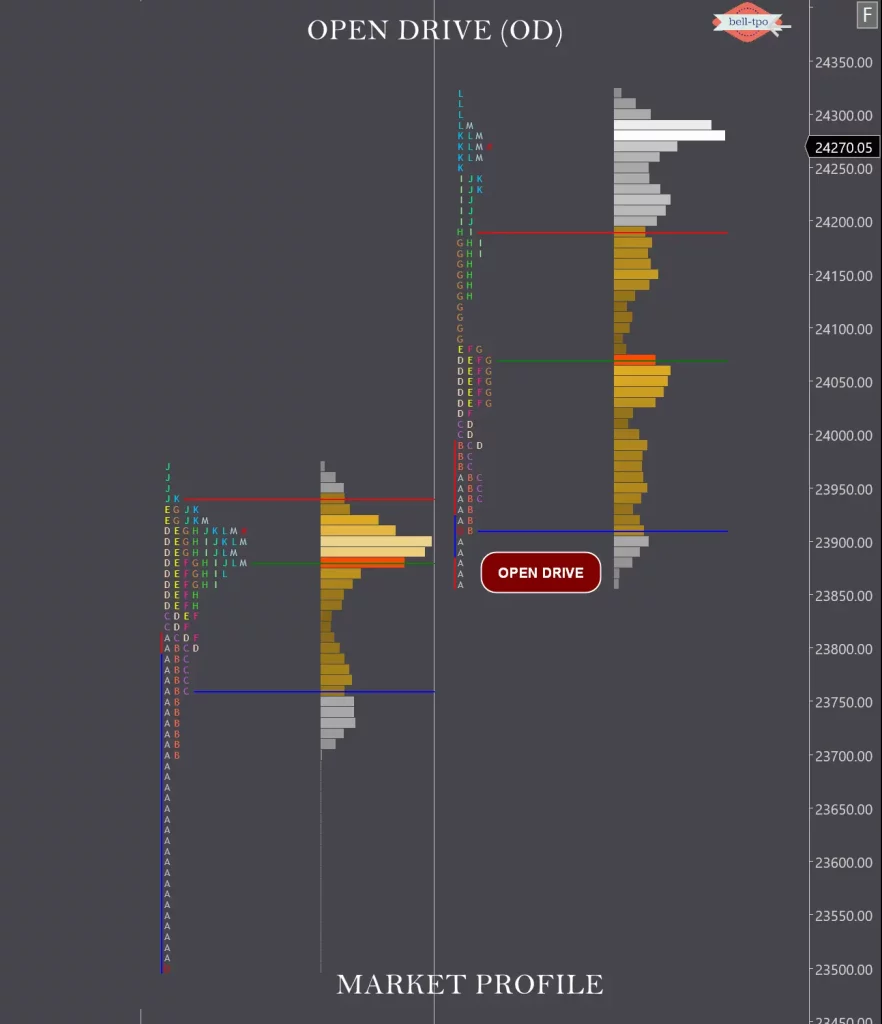
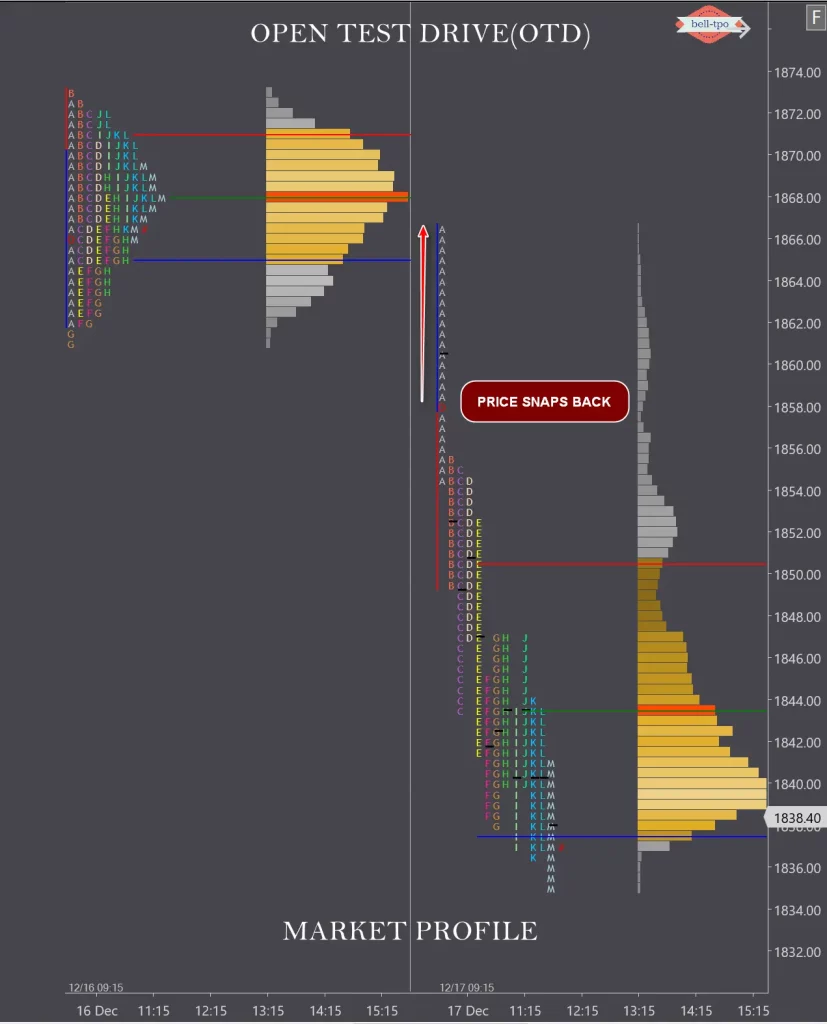
Open Drive (OD)
Open Drive exhibit maximum confidence from the OTF timeframe traders
Opens Gap up and Never got back into the previous day range
Opens Gap up and Trades in the same direction of the previous day
Low made in the first 30 min never taken out throughout the day
Witnessed more in Bear market counter rally
Market Profile is a charting technique that organizes price, time, and volume into a distribution format. It represents the market as an auction process, helping traders identify where most trading activity occurs (value areas).
2. What are the key components of a Market Profile chart?
Market Profile focuses on the auction process, showing where market participants find value, while candlestick charts focus on price movement over time.
4. What is a TPO in Market Profile?A TPO represents a price level touched during a specific time interval, usually a 30-minute period.
5. What does a ‘Profile’ mean in Market Profile?A Profile is a single day’s trading activity displayed in a Market Profile chart. It is made up of time-price opportunities (TPOs).
6. What are TPOs in Market Profile?TPOs (Time Price Opportunities) are letters or symbols used to mark the prices where trades occurred during a specific time interval, usually 30 minutes.
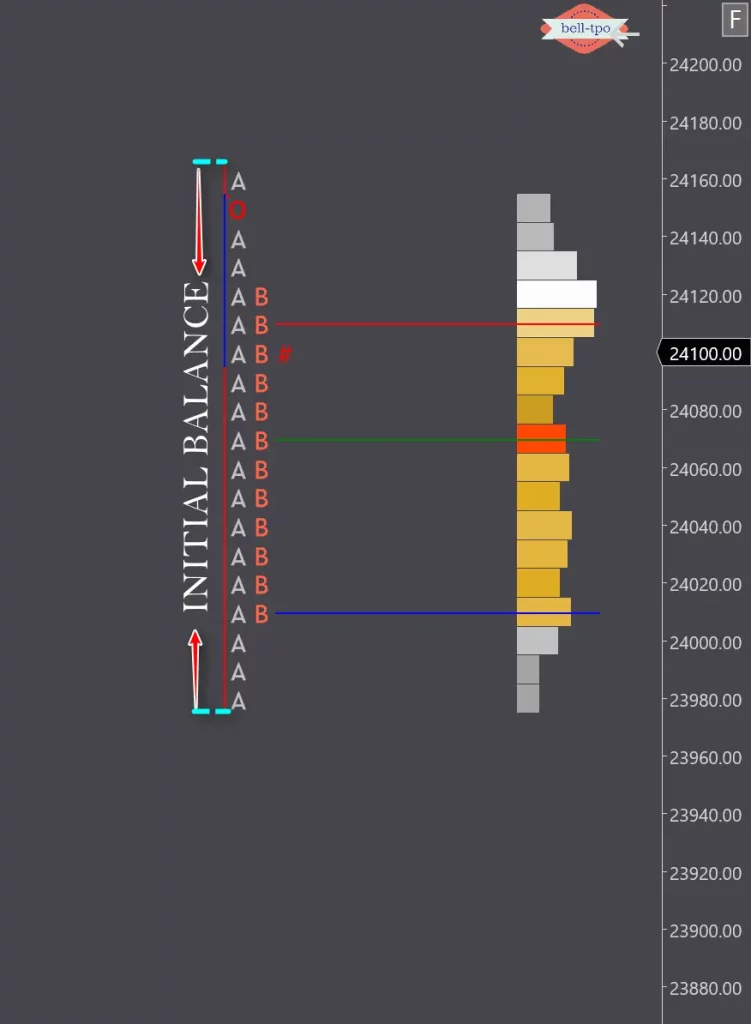
7. What is the ‘Initial Balance (IB)’?The Initial Balance is the range of prices traded during the first hour of a trading session. It sets the foundation for analyzing the day’s activity.
8. What are ‘Single Prints’ in Market Profile?Single Prints are price levels where trading occurred during only one time period. They often indicate support or resistance levels.
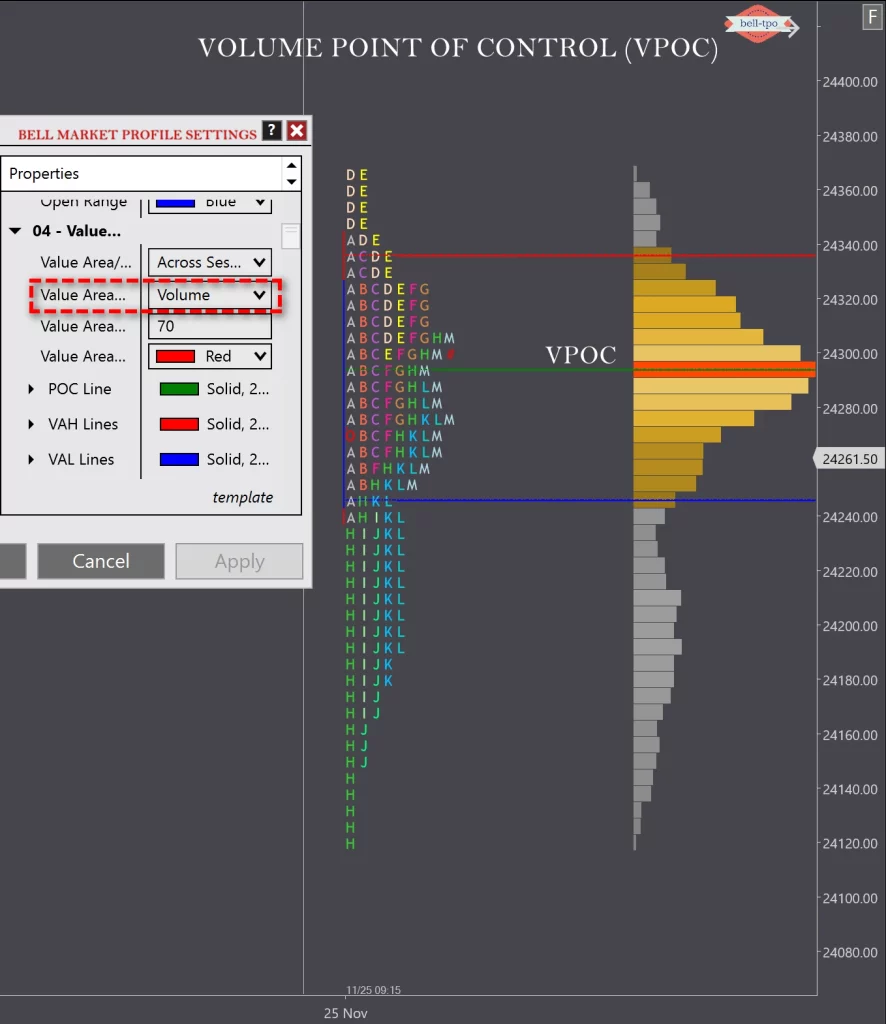
9. What is the Value Area, and how is it calculated?The Value Area represents the price range where 70% of trading activity occurred during a session. It helps traders identify important price levels.
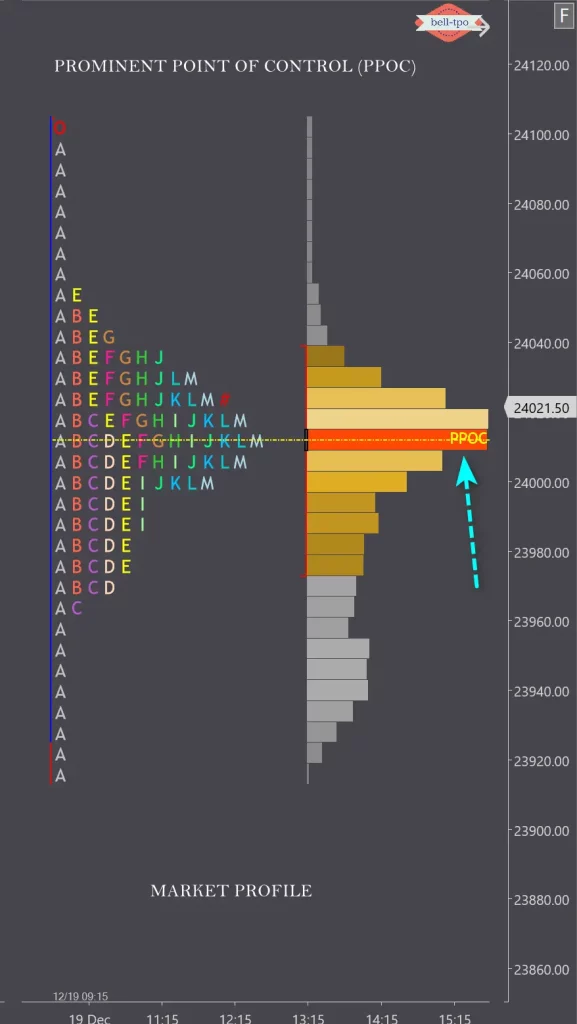
10. What is the Point of Control (POC)?The Point of Control is the price level with the highest traded volume in a session. It indicates the price where traders showed the most interest.
11. What are POC (Point of Control) and how is it used in trading?The POC is the price level with the most trading activity. It often acts as a magnet for price and can indicate areas of support/resistance.
12. What are high-volume nodes and low-volume nodes in Market Profile?High-Volume Nodes (HVNs): Price levels with significant activity, often acting as support or resistance. Low-Volume Nodes (LVNs): Price levels with minimal activity, often areas where price moves quickly.
13. How can you identify support and resistance levels using Market Profile?Use the POC, value area boundaries, and single prints to identify support and resistance zones.
14. How does Market Profile help traders?Market Profile helps traders identify key price levels, assess market trends, and make better trading decisions by showing where buyers and sellers are most active.
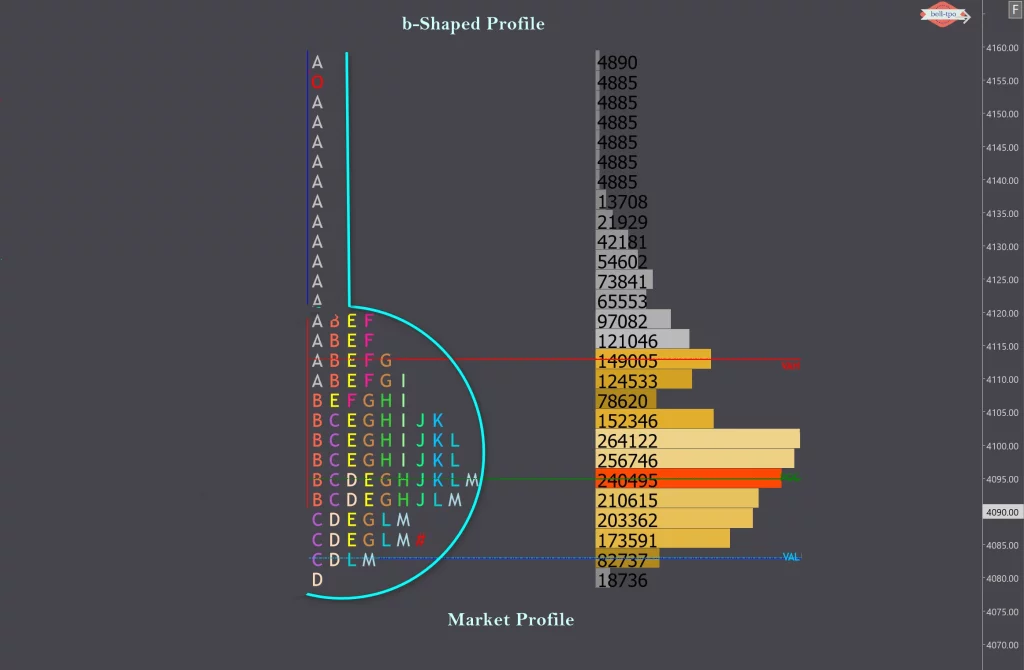
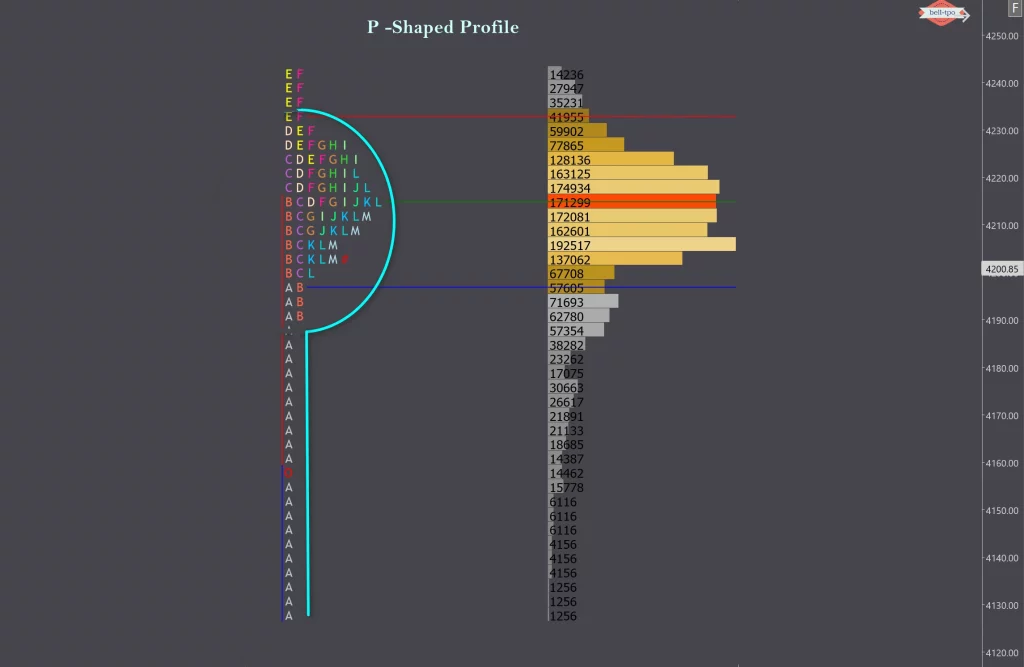
15. What is a ‘Balanced Profile’?A Balanced Profile is a bell-shaped profile where trading is evenly distributed. It indicates a market in equilibrium, with buyers and sellers in agreement.
16. What is an ‘Imbalanced Profile’?An Imbalanced Profile shows skewed trading activity, where either buyers or sellers dominate. It can signal the start of a trend.
17. What tools or software can I use for Market Profile?Popular trading platforms like NinjaTrader, and BellTPO offer Market Profile charting tools.
17. Is Market Profile suitable for beginners?Yes, but beginners should first understand basic market concepts like support, resistance, and volume before diving into Market Profile.
18. What are the limitations of Market Profile?Market Profile requires skill to interpret and is best suited for markets with high liquidity. It may not work well in low-volume markets or for long-term analysis.
19. What is a poor high or poor low in Market Profile, and what does it signify?A poor high/low occurs when the auction process ends abruptly, indicating incomplete price exploration and potential reversal.
20. How do Market Profile concepts help in understanding market sentiment?The shape of the profile, movement of the POC, and value area shifts provide insights into bullish or bearish sentiment.
21. What are the different Market Profile shapes (D-shape, P-shape, b-shape), and how do they influence trading decisions?
Look for overlapping value areas, POCs, or single prints across multiple sessions to identify high-confluence zones
25. How does Market Profile integrate with other tools like Order Flow and Volume Analysis?
Monitor poor highs/lows, single prints, and shifts in value areas for early reversal signals.
27. What are some common pitfalls when using Market Profile, and how can they be avoided?