
Market Profile
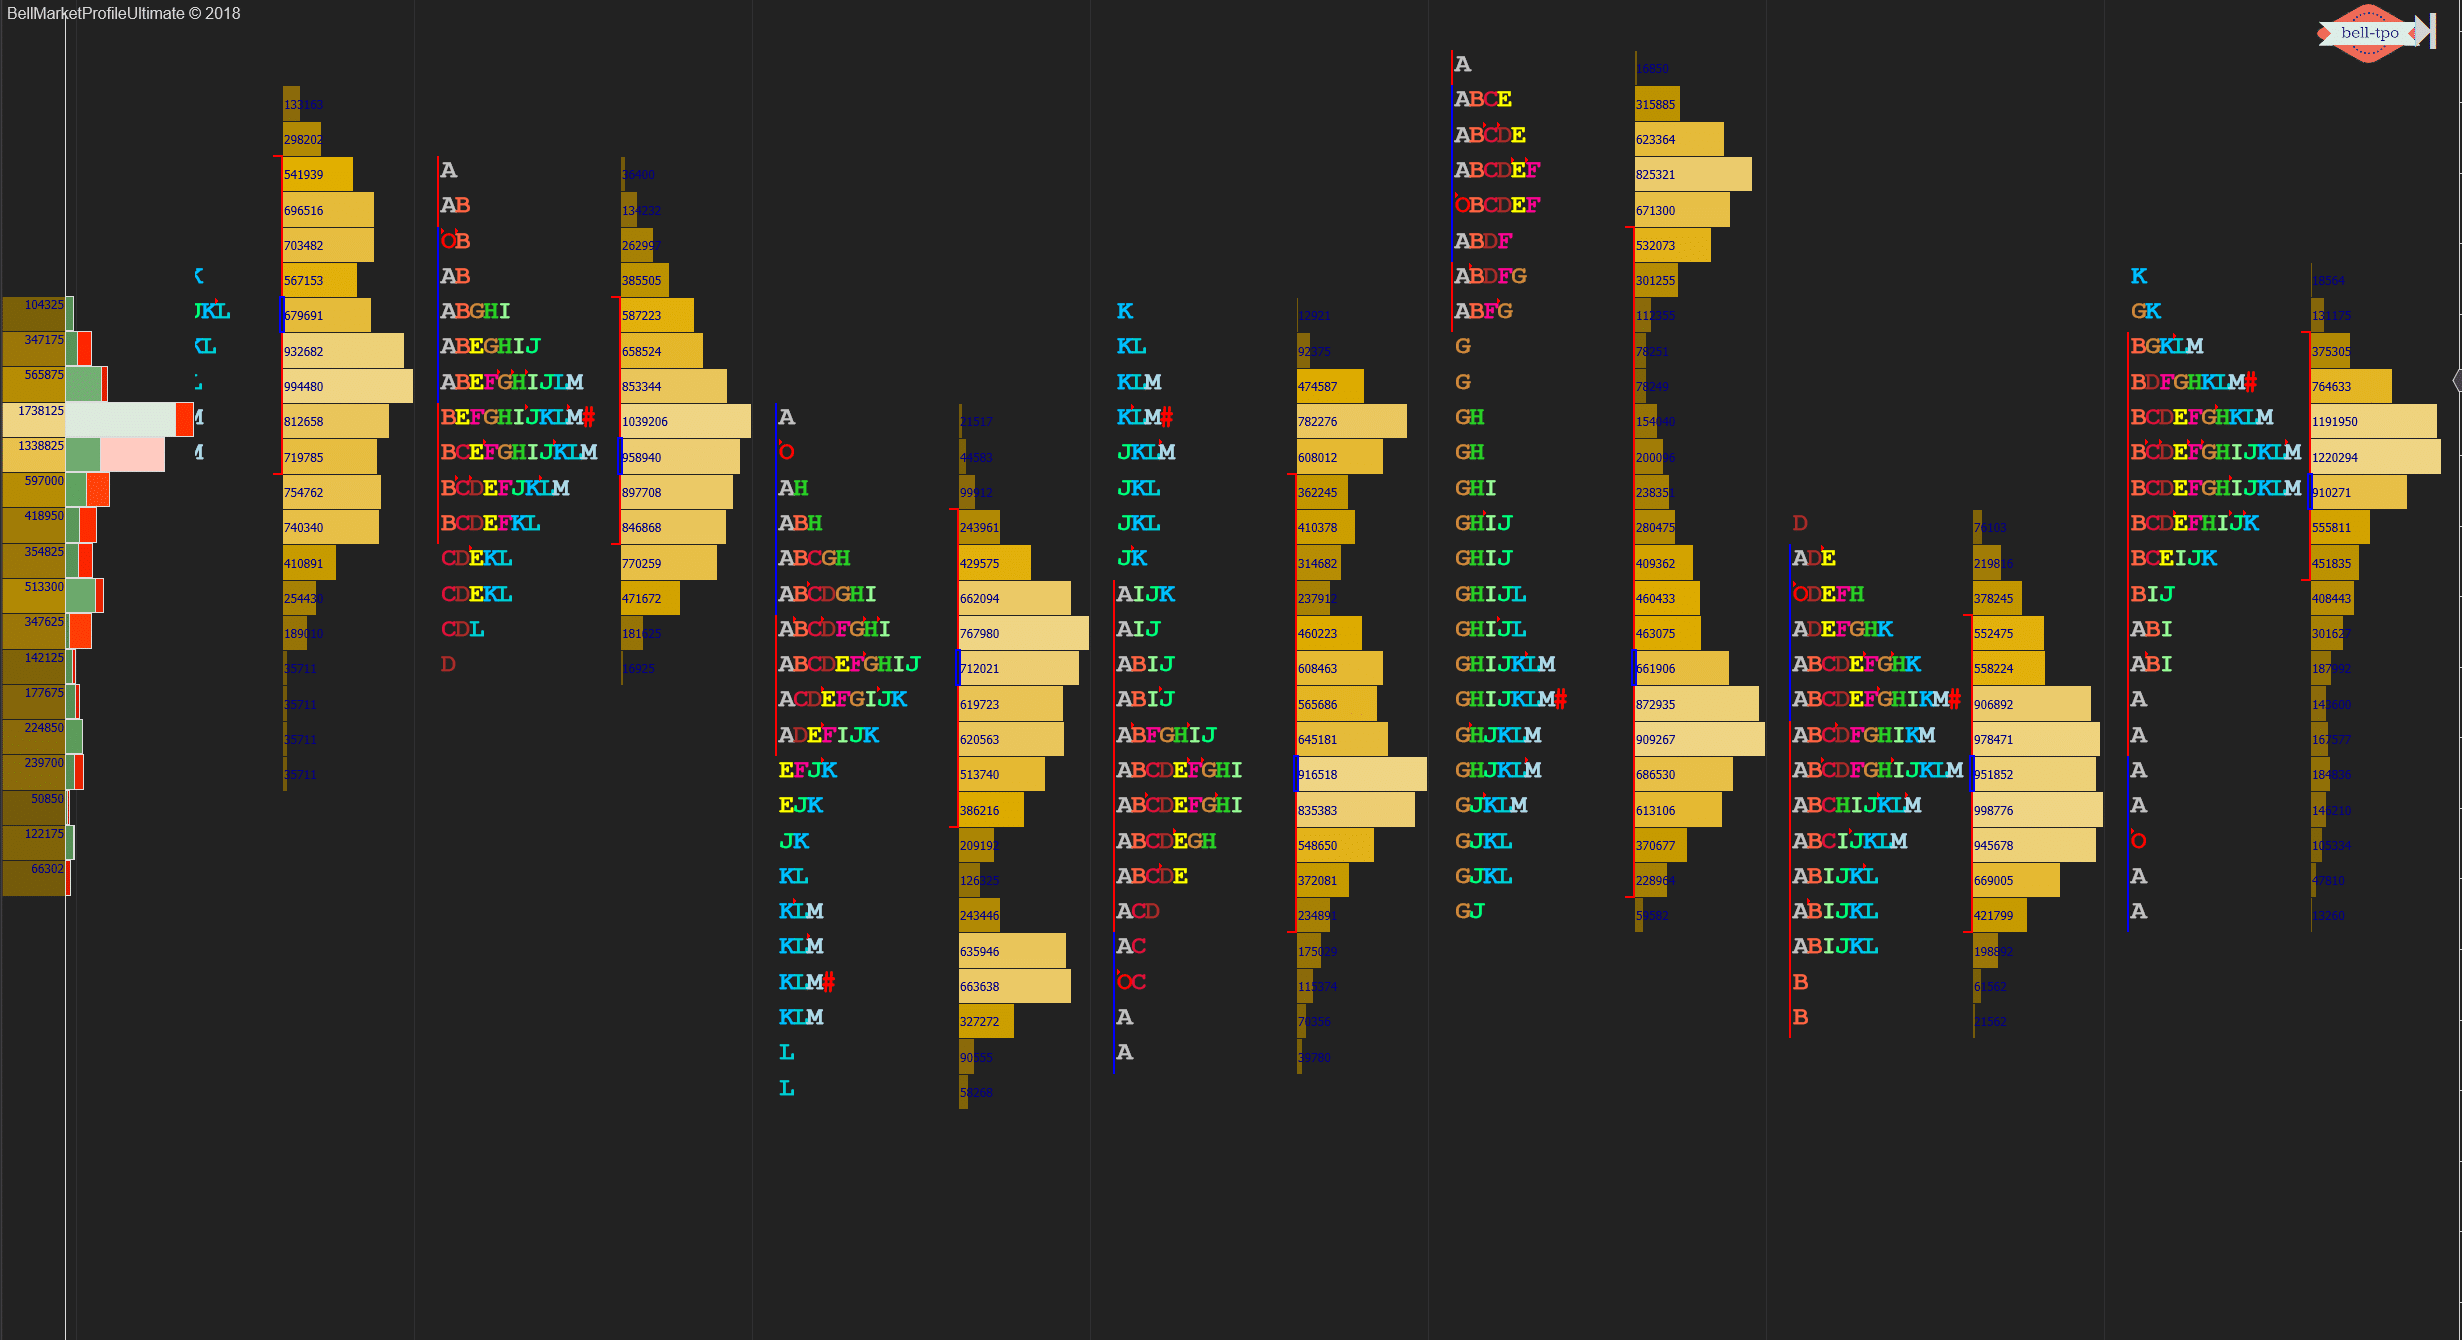
Market profile charts display the price on a vertical scale same as other charting tools such as bar or candle stick charts. However, unlike candlestick charts, the additional information such as volume and time is also combined in graphical form. The volume appears on a horizontal scale and the timeframe uses a combination of letters and/or colors. Understanding the price is quite straightforward. Let us explain the basic terms of market profile ie. Price,Volume and Timeframe widely known as TPO or Time Price and Opportunity.
- Price: Market profile charts display the price in the same way as any other charting applications use, with the price scale being displayed on the right side of the chart.
- Volume: The volume on a market profile chart is displayed as a horizontal histogram. The longest horizontal lines showing the greatest amount of volume. This means that the price that has the longest horizontal line is the price where most of the volume has been traded. This price is also known as the Point of Control or (POC) because it’s the price that had control of the market most of the time.
- Time Frame: The time frame on a market profile chart uses letters and/or colors. Each letter represents one unit of the time frame when letters are used, such as 5 minutes or 1 hour. Each color also represents one unit of the time frame when colors are used. A 10-minute chart would use colored squares, each of them representing 10 minutes of trading. A trader can easily see which prices have been traded most recently if he knows which color is the most recent.
- Value Area : There is always price and value; they are not necessarily the same. The value area is where approximately 70% of a day’s business is conducted. This is logical for the middle part of a bell shaped curve is where most activity occurs and indicates where two-side trade is taking place.
Market profile charts can be used as a complete trading system or as part of a larger trading system that also uses other charts. Either way, market profile charts are usually traded based on support and resistance and on how the price interacts with the point of control, which would be the most traded price. A day trader might trade bounces off the most recent point of control, while a swing trader might trade breakouts of yesterday’s point of control.