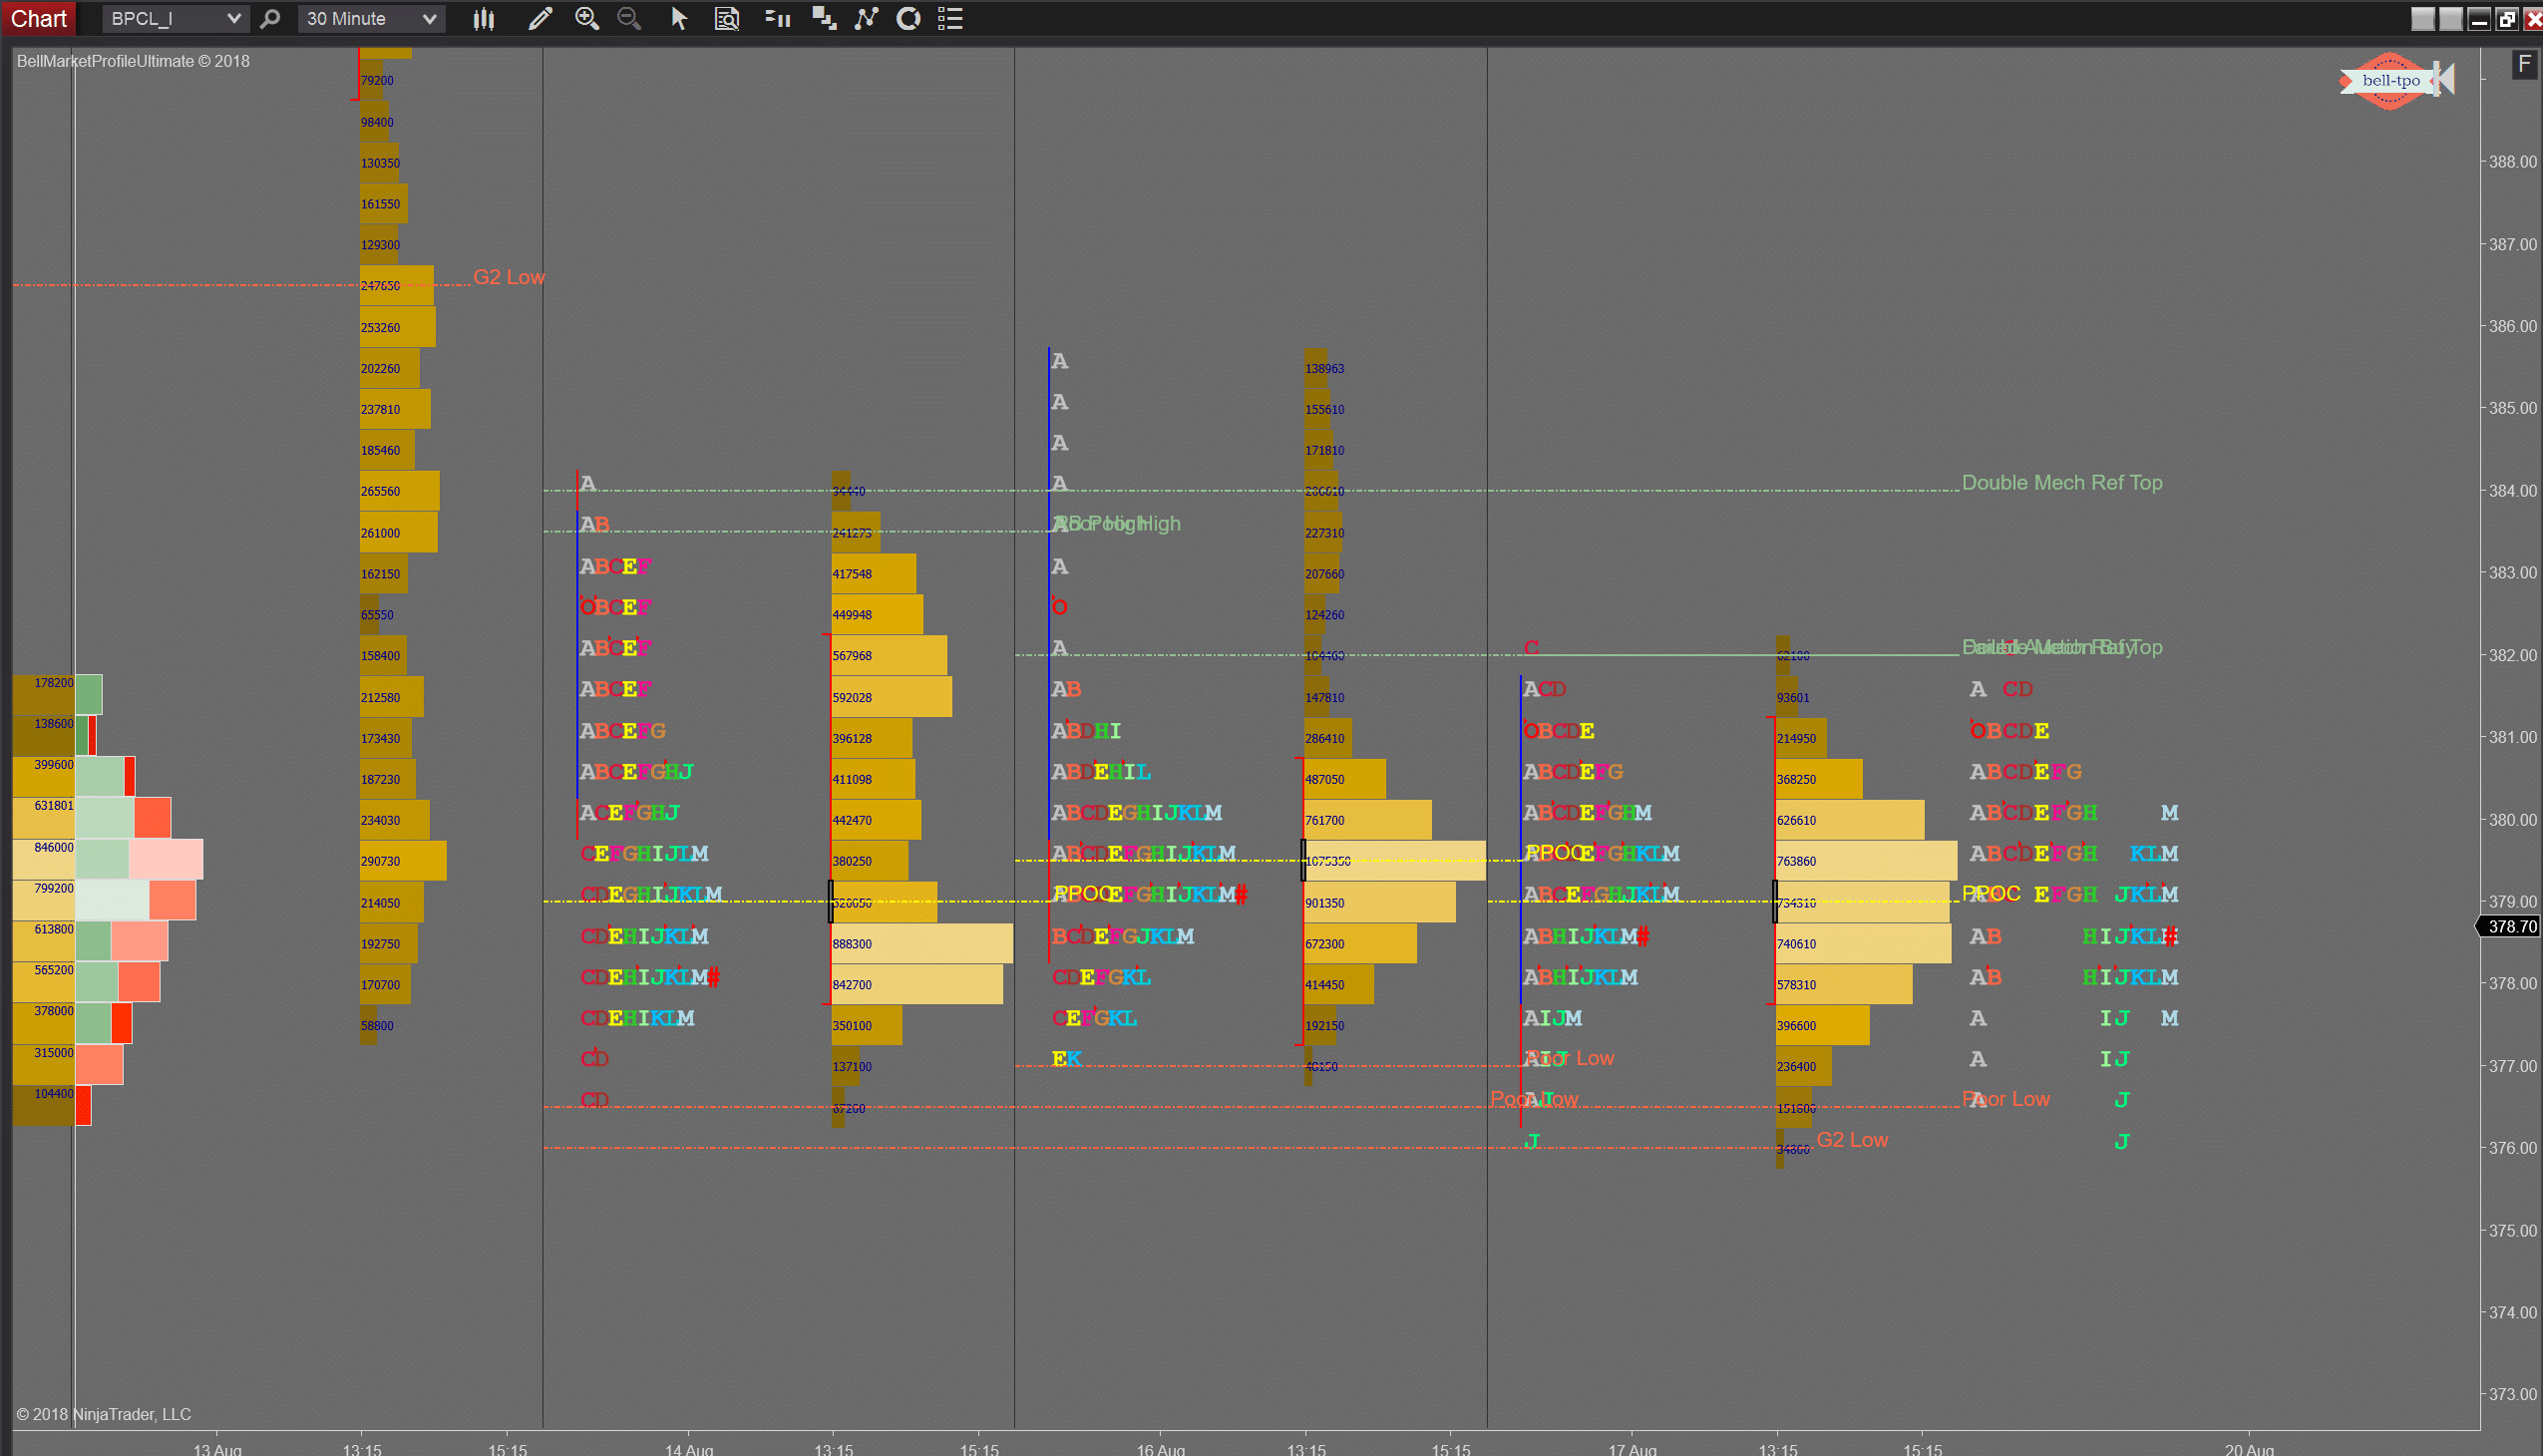
Market profile Vs Traditional indicators:
Market profile charts combines all the information on the single chart such as Price, Volume and Time in a graphical form. Market profile charts can be splitted or combined on different time frame and can give the trader more inner information on how the buyers/ sellers are behaving at a particular price/ time. The price/ volume information appears on a horizontal scale and the timeframe uses a combination of letters and/or colours. Understanding the price is quite straightforward. By reading the market-generated information one can learn who is in control in the market (Buyers or Sellers) and how much confident they are in driving the prices higher or lower. Whereas in a candlestick/ bar chart, it is not easy to find the inner information on the chart. The Market Profile’s unique construction produces a display that contains structure. It reveals far more information than the one – dimensional view inherent in conventional candlestick or bar charts, which do not expose character of the market – where the majority of business took place, at what price levels, and for how long. The Profile conveys significantly more information that provides the experienced observer with clues about both the complexity and the nuances driving the ongoing auction.
